Business Intelligence
Make better data-driven decisions. React to real-time data, review with detailed reports, and reveal hidden possibilities and value using your favorite tools.
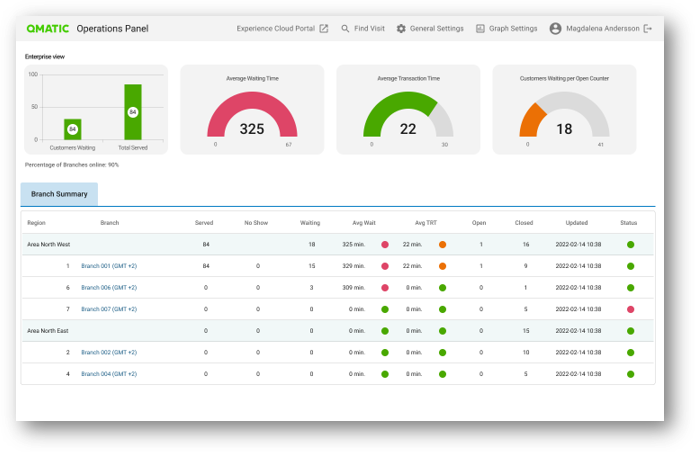


Monitor your operations in real-time
- Average wait times
- Total served
- No-shows
- Customers waiting
- Average transaction time
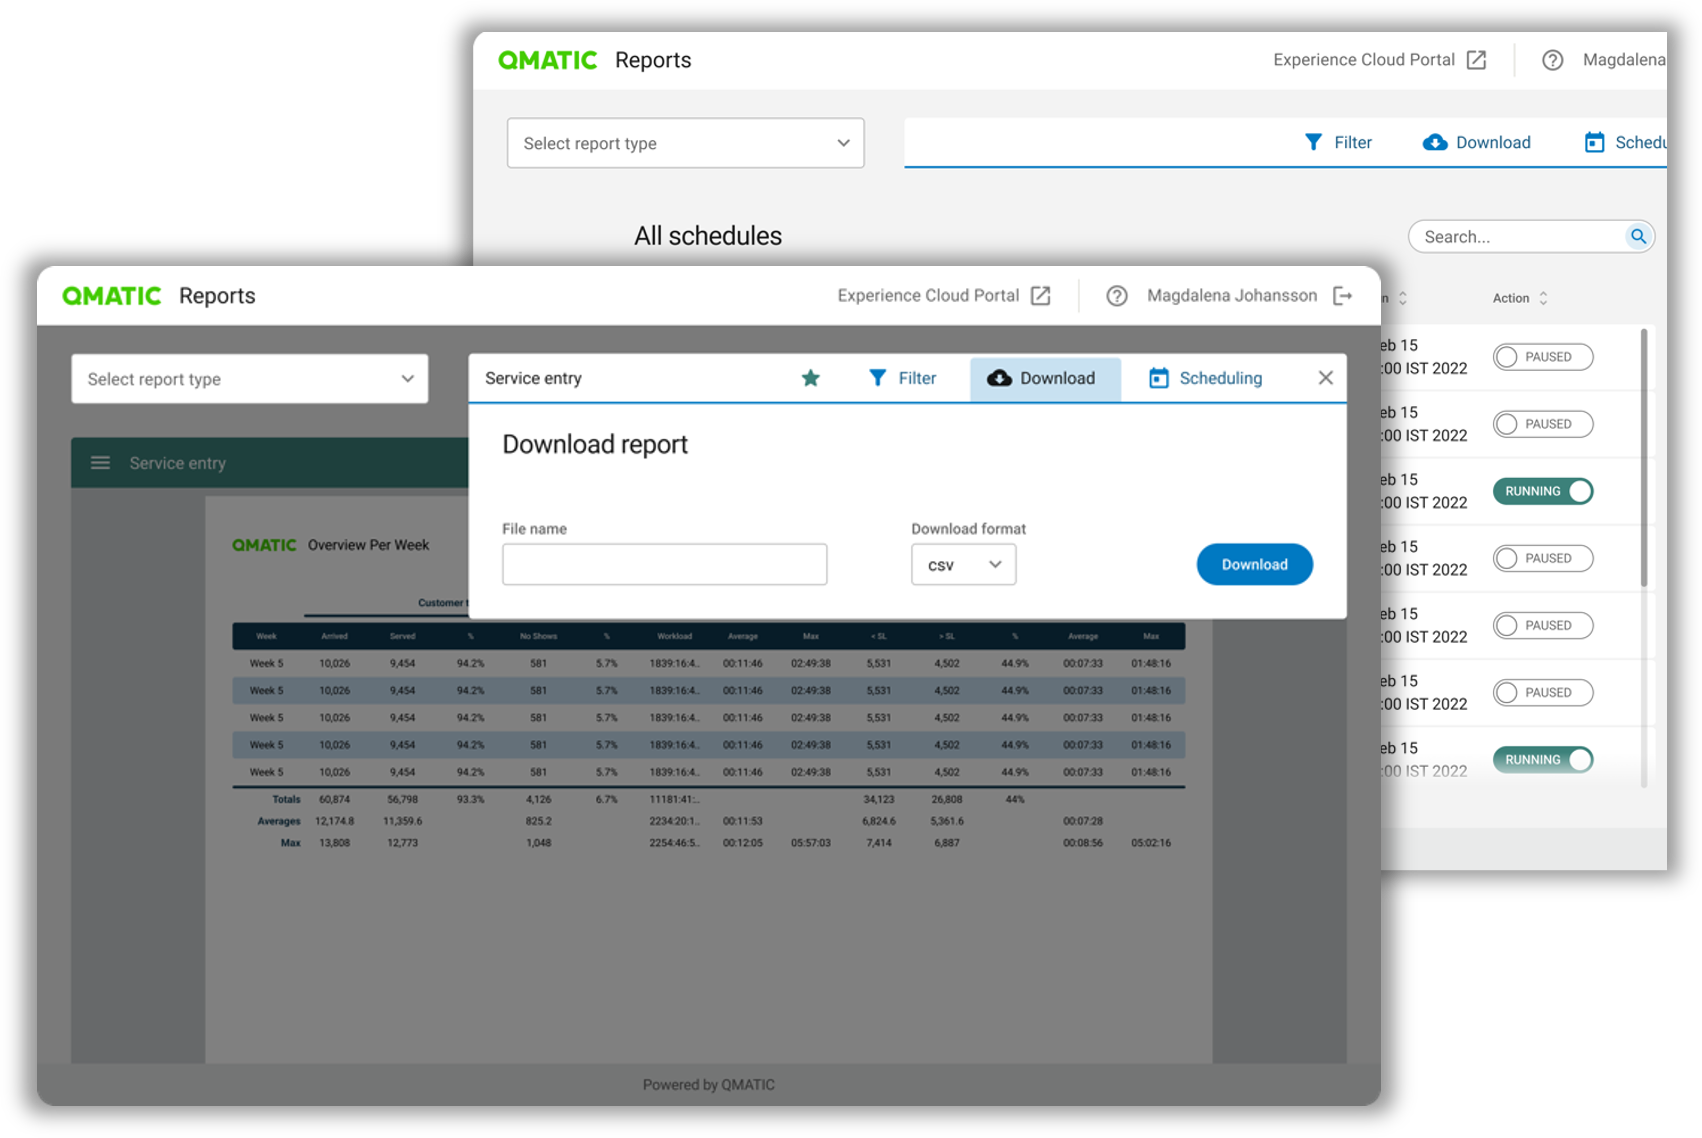
Generate comprehensive reports
- Generate reports on your most important performance metrics
- Improve the reporting process for managers and teams, ensuring seamless access to necessary data.
- All reports can be downloaded in PDF CSV or XLSX format.
- Schedule reports and receive all your data straight to your email—daily, weekly, or monthly.
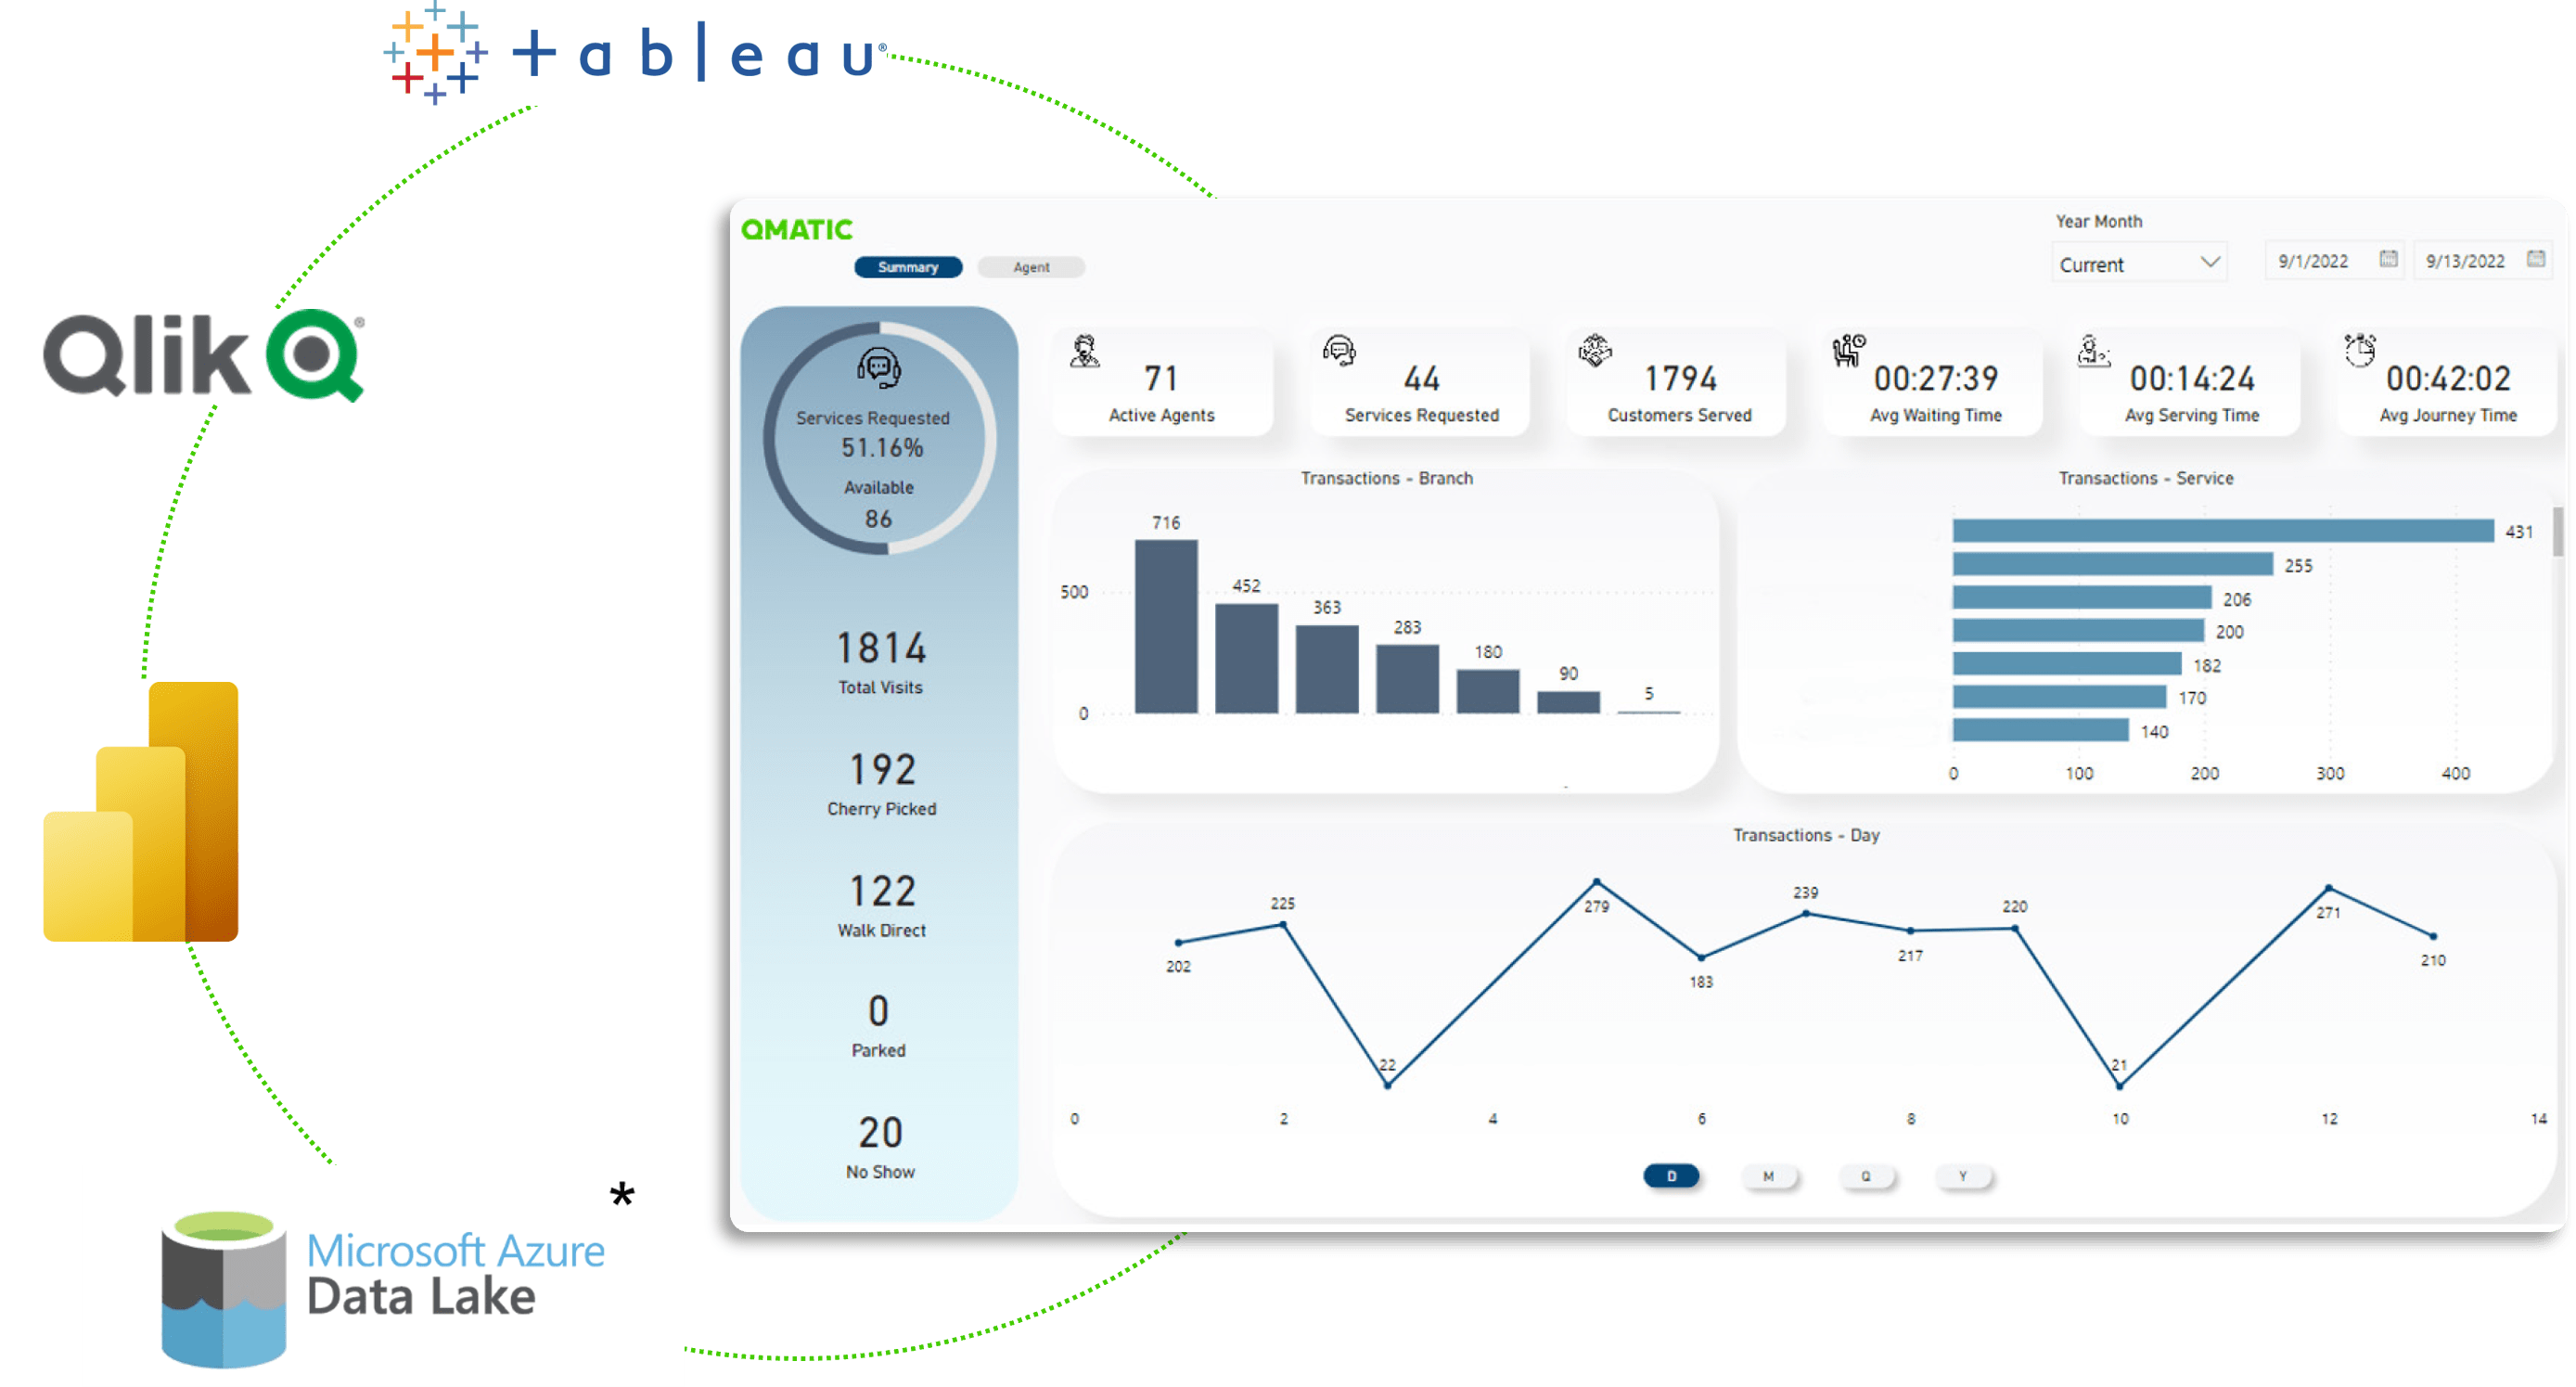
Integrate and analyze data in your own way using your existing BI tools.
- Unlock your most valuable insights with the Data Connect API
- Use your favorite BI tools such as Power BI, Tableau and QlikView
- Integrate seamlessly with other systems and data sources to reveal hidden value
- Easily import 70+ data points from the Qmatic platform
Making better data-driven decisions for a better customer service
Branch performance
Compare branches in different KPIs such as the number of no-shows and service level waiting time.
Daily patterns
Understand booking, arrival and serving trends. Find bottlenecks and define the workload at different times.
Staff performance
Compare staff on average transaction time for service and help staff learn from the best for increased performance.
Customer feedback and NPS
Understand when waiting times influence the customer experience or NPS (Net Promoter Score). Find the tipping point to define your service level waiting time.
Appointment analysis
Learn how many of the customers arrived for their appointments, how many arrived early or late, and analyze the booked time versus the service time to see if the appointment slots are realistic.
Waiting time and transaction time distribution analysis
Find out what your waiting and transaction times values really are, not by looking at an average but by how they are distributed in time slots.
Time/date trend analysis
Analyze no-show rates, or pre-booked appointments vs walk-ins and compare it with specific times and dates to learn which your busiest periods are.