


Ask in your own language
Type the question the way you would ask a colleague, in the language you work in. AI Insights answers in the same language.
Platform

Enterprise solution built for organizations with complex requirements, multiple service points, and branches

An intuitive, dynamic all-in-one platform that creates seamless customer journeys and enhanced customer and employee experiences with its suite of solutions and services

See Qmatic Cloud Solution from the inside
Customer journey management

Create more valuable and personalized experiences for your customers through simple scheduling

Gain a clear overview of your resource allocation, identify gaps, and optimize utilization to meet customer demand

Empower your staff to deliver faster, smoother customer service.

Journey Management is the core orchestration engine within Qmatic Orchestra Platform.

Create a seamless first impression from the moment customers arrives.

Elevate your customer experience with informative and engaging digital signage solutions

Let your customers wait virtually, anywhere, with virtual queues

Ensure your system is always optimized and working perfectly

Connect your favorite tools to Qmatic and empower your customer journey management system with third-party integrations.
Platform

Turn customer journey data into actionable insights with AI-powered analytics to optimize operations, improve efficiency, and enhance customer experiences.

AI-powered agents that automate customer interactions, manage appointments, and guide visitors across phone, web, and in-person channels, 24/7.
Products

An intelligent assistant on your website that guides visitors, answers questions, and books appointments – automatically, 24/7

AI Voice Agent for Enterprise: From scheduling appointments to answering FAQs and sending SMS confirmations.

Monitor queues, wait times, and service performance in real time with AI-powered forecasts and insights to optimize staffing and improve operational efficiency.

Turn customer journey data into actionable insights with AI-powered reporting, allowing you to ask questions in natural language and make smarter, data-driven decisions.
Industries

Manage and optimize the flow of patients from arrival to discharge

Deliver accessible and efficient services that meet citizen expectations

Provide a frictionless customer experience that boost loyalty and sales

Provide fast and efficient services and improve the customer and workforce experience

Manage visits and appointments at your branch offices with ease

Create easy access to student services both on-campus and online
Become a partner

Explore the benefits of partnering with Qmatic

Grow your business by selling Qmatic solutions

Build integrated solutions that extend Qmatic capabilities

Deliver certified hardware for seamless Qmatic solutions

Find a Qmatic partner in your region
Insights

Explore insights, trends, and ideas shaping the future of customer journeys.

See how organizations use Qmatic to improve customer experiences and operations.

Explore guides, reports, webinars, and other resources from Qmatic.

Stay up to date with the latest news and announcements from Qmatic.

Explore how Qmatic makes its products and solutions more accessible and inclusive for everyone.
About Qmatic
Products
Qmatic AI
Solutions
Partners
Become a partner
For Partners
Insights
Insights
About Qmatic
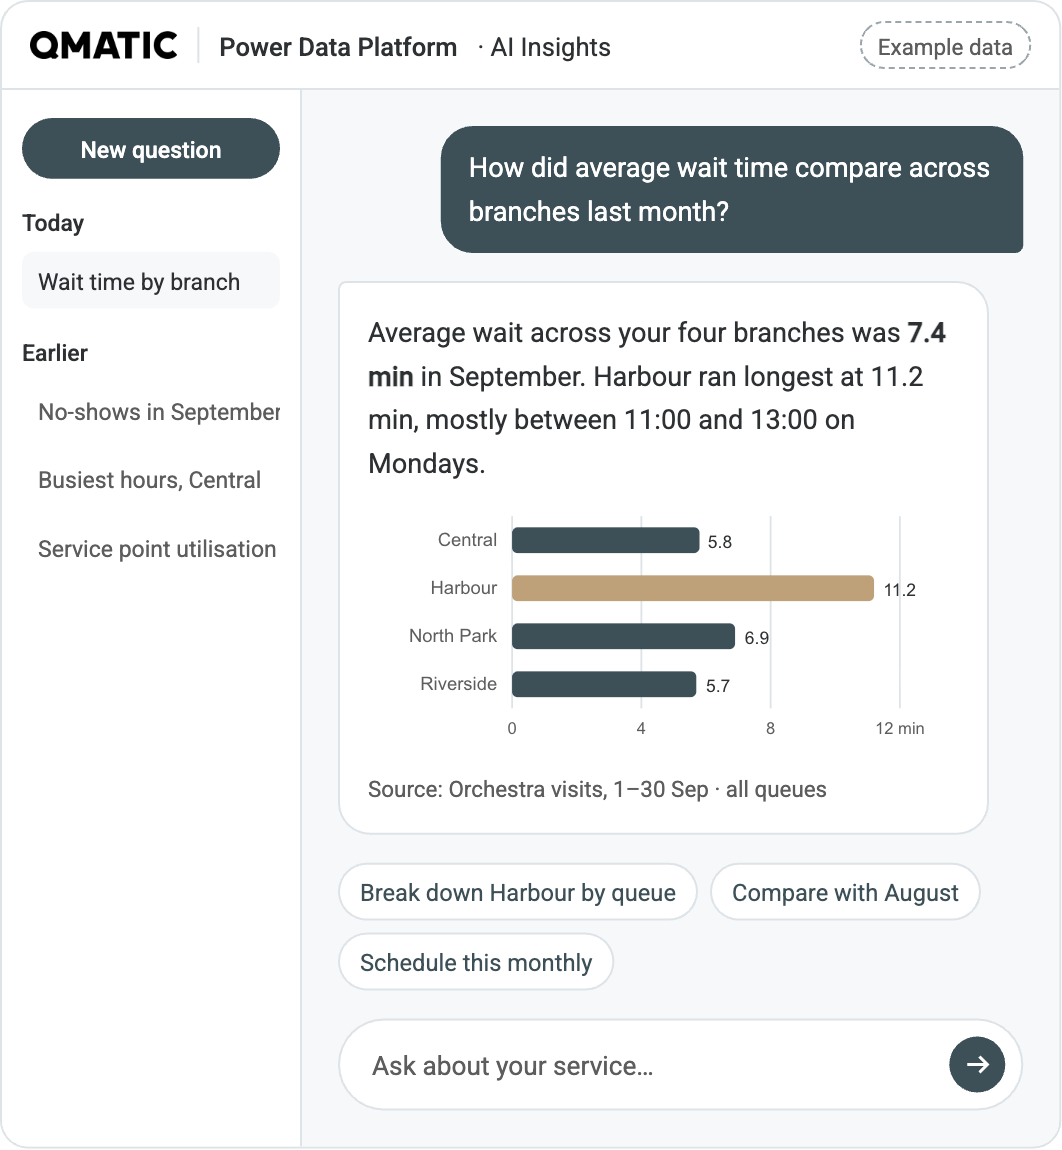
Questions about your service history, answered in seconds with charts. Ask in your own language, follow up until you have the full story, and schedule the answers you need every week.
Type the question the way you would ask a colleague, in the language you work in. AI Insights answers in the same language.
Every answer comes with a short explanation and a chart you can read at a glance.
Put locations, queues or periods side by side, and find the days and hours that drive long waits.
Save any question as a report and get the latest answer every day, week or month, without asking again.
Transaction times, utilisation and volumes served per service point.
Booking volumes, arrival patterns and no-show rates, so you can tune your appointment setup.
Prepare the monthly review in minutes instead of a day.
Check the effect of a change without building a new report.
Plan rosters around the patterns your branch actually has.

Answers come from your own Orchestra service data.

Staff names are never sent to the AI model.

Your data is not used to train AI models.